Correlation — when two trades are really one
Short · Risk & sizing · October 7, 2026
Olympia publishes educational content for learning purposes only. Past performance is not indicative of future results. Nothing here is investment advice.
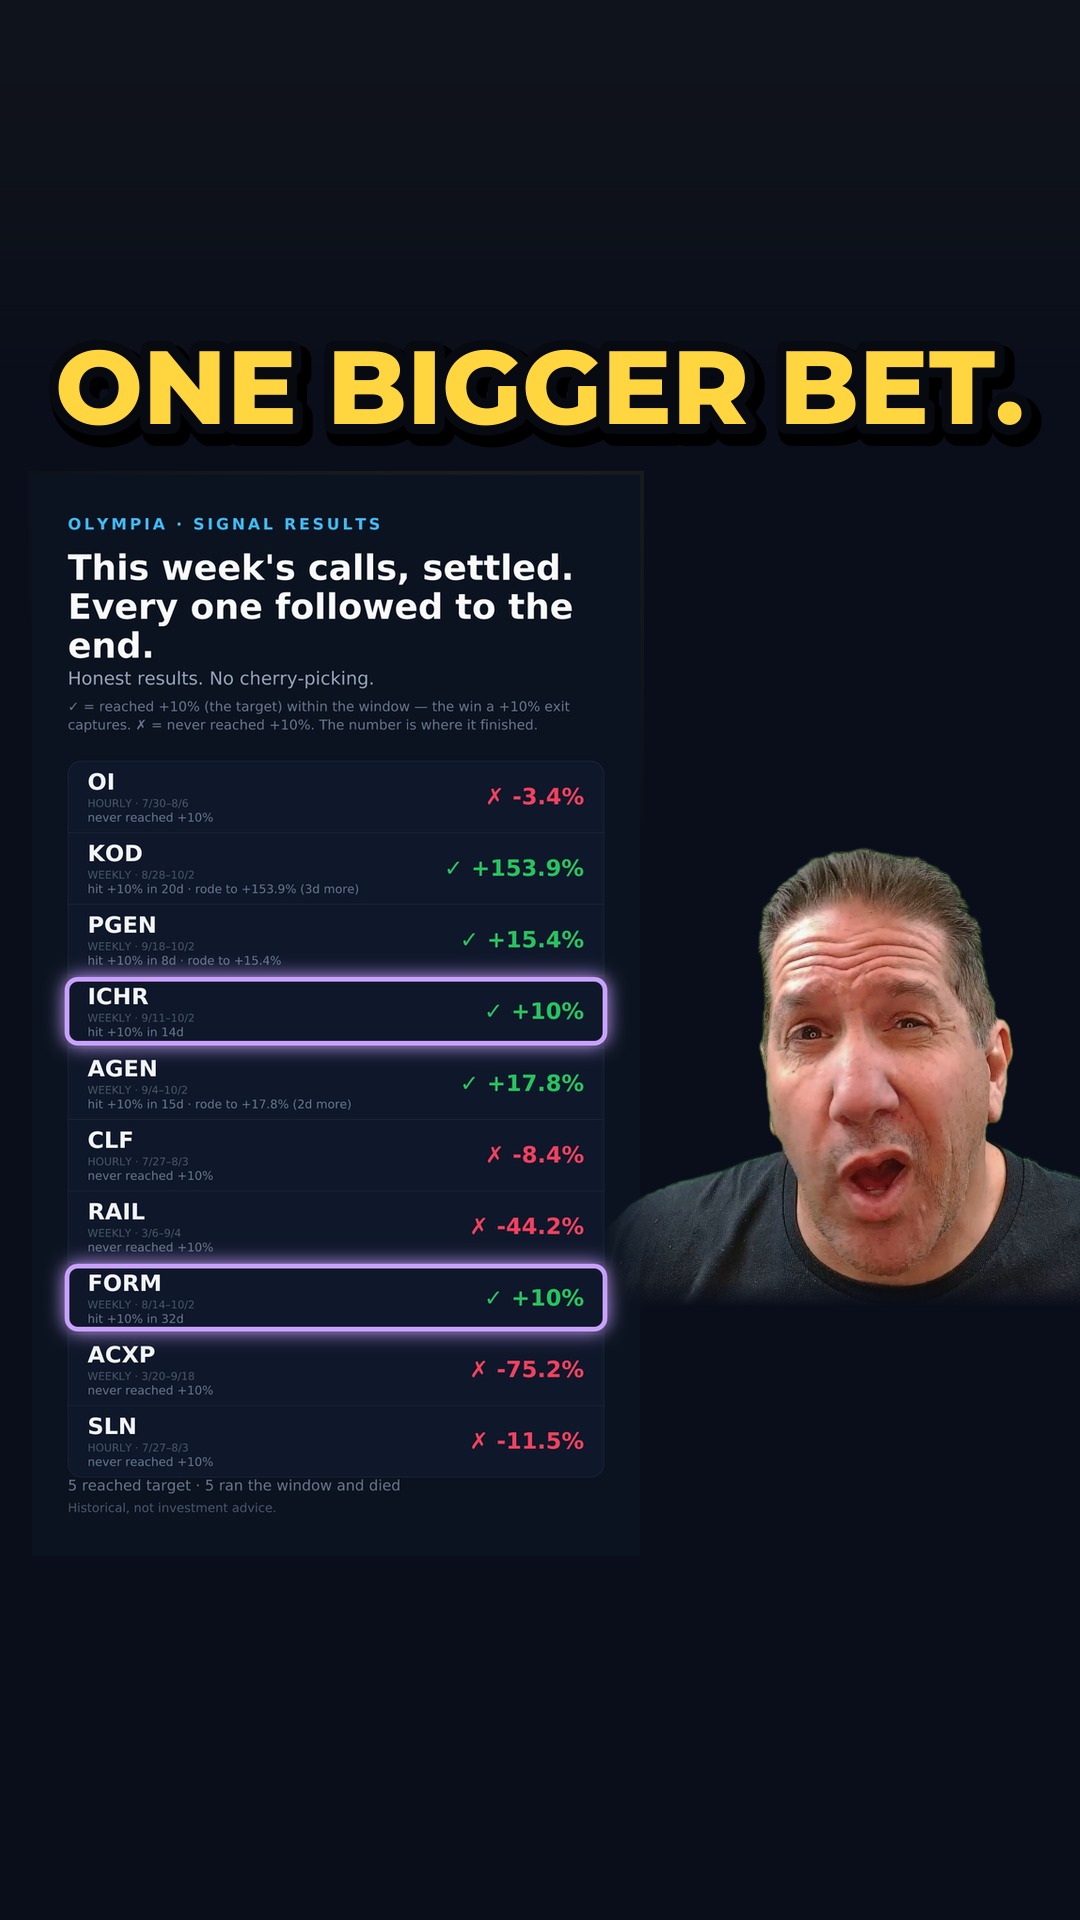
Correlation is how closely two stocks move together, measured on their daily moves: one is lock step, zero is no steady link, minus one is opposite. Five chip stocks with $250 at risk on each aren't five small bets — on a bad day for chips they're one bet of about $1,250.
Part of the full lesson: How much should I risk across all my trades? Portfolio heat
The lesson in writing
Correlation is how closely two stocks move together. When two trades move together, they're actually one. It's a bigger bet.
How it's worked out
It's measured on their daily moves. One means lock step. Zero means no steady link. And minus one means they actually move opposite.
So let's say we had five chip stocks with $250 at risk on each. They're not five small bets: on a bad day for chips they're one bet of about $1,250.
Don't count your fighters, count your gyms.
What that does to the risk you actually have on is in How much should I risk across all my trades? Portfolio heat.
Example numbers, not a member's: five positions with $250 at risk on each. The correlation scale is the standard one, measured on daily moves.