How much should I risk across all my trades? Portfolio heat
Lesson · Risk & sizing · October 7, 2026
Olympia publishes educational content for learning purposes only. Past performance is not indicative of future results. Nothing here is investment advice.
One trade sized right can't knock you out. Five of the same trade can. Position sizing across the whole book: portfolio heat, correlation, concentration versus diversification, and sizing to conviction without going past the cap.
The lesson in writing
One trade sized right can't knock you out and take you out of the fight. Five of the same trade can definitely take you out.
I'm Mike, I built Olympia, and this one is about the book — the same thing hedge funds look at. They don't look at just one trade. They look at how much is on the line at once, and how much one idea gets to own the whole strategy.
What it is
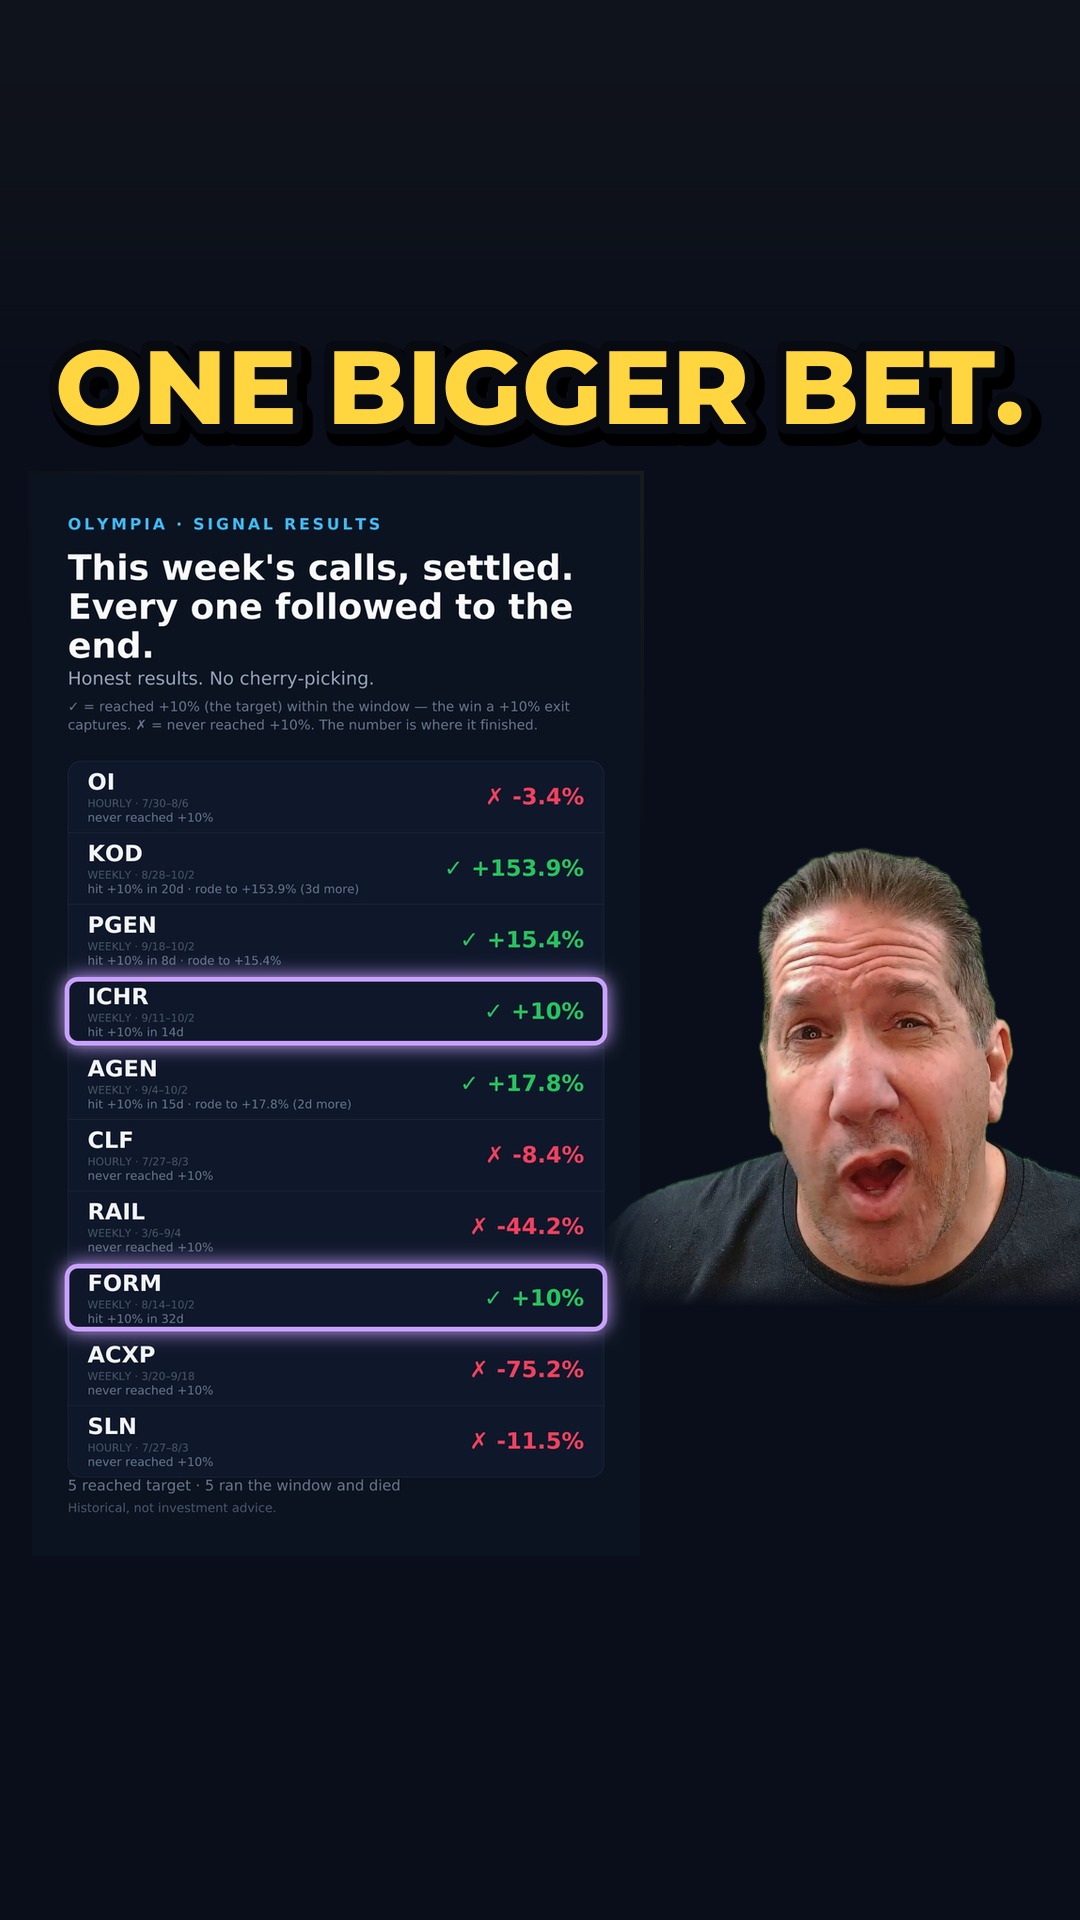
Every trade was risked. They looked fine. You were confident. And then the worst happened: they all lost on the same day.
Heat is the total risk on across every open trade at once. One trade stinks; heat is what puts you on the canvas, and too much heat keeps you on the canvas.
Correlation is how closely two stocks move together. When two trades move together they're actually one — a bigger bet. It's measured on their daily moves: one means lock step, zero means no steady link, and minus one means they move opposite. Don't count your fighters, count your gyms.
Concentration is how much of one idea gets to own your whole book. Diversification spreads it so no single idea can take you out of the fight.
How it's worked out
Trade by trade: entry minus stop, times the shares, and then you add them up. Five trades each sized to lose two hundred and fifty dollars is $1,250 on the line — and if every one of them bails on the same day, you've lost 5% of a $25,000 account at once.
Correlation stacks that. Five chip stocks with $250 at risk on each are not five small bets: on a bad day for chips they're one bet of about $1,250.
Concentration is that position over the whole book. If you have $2,000 in one name out of $25,000, that's 8% of your account. Too thin and your best idea barely moves the needle; too concentrated and one miss takes out the year.
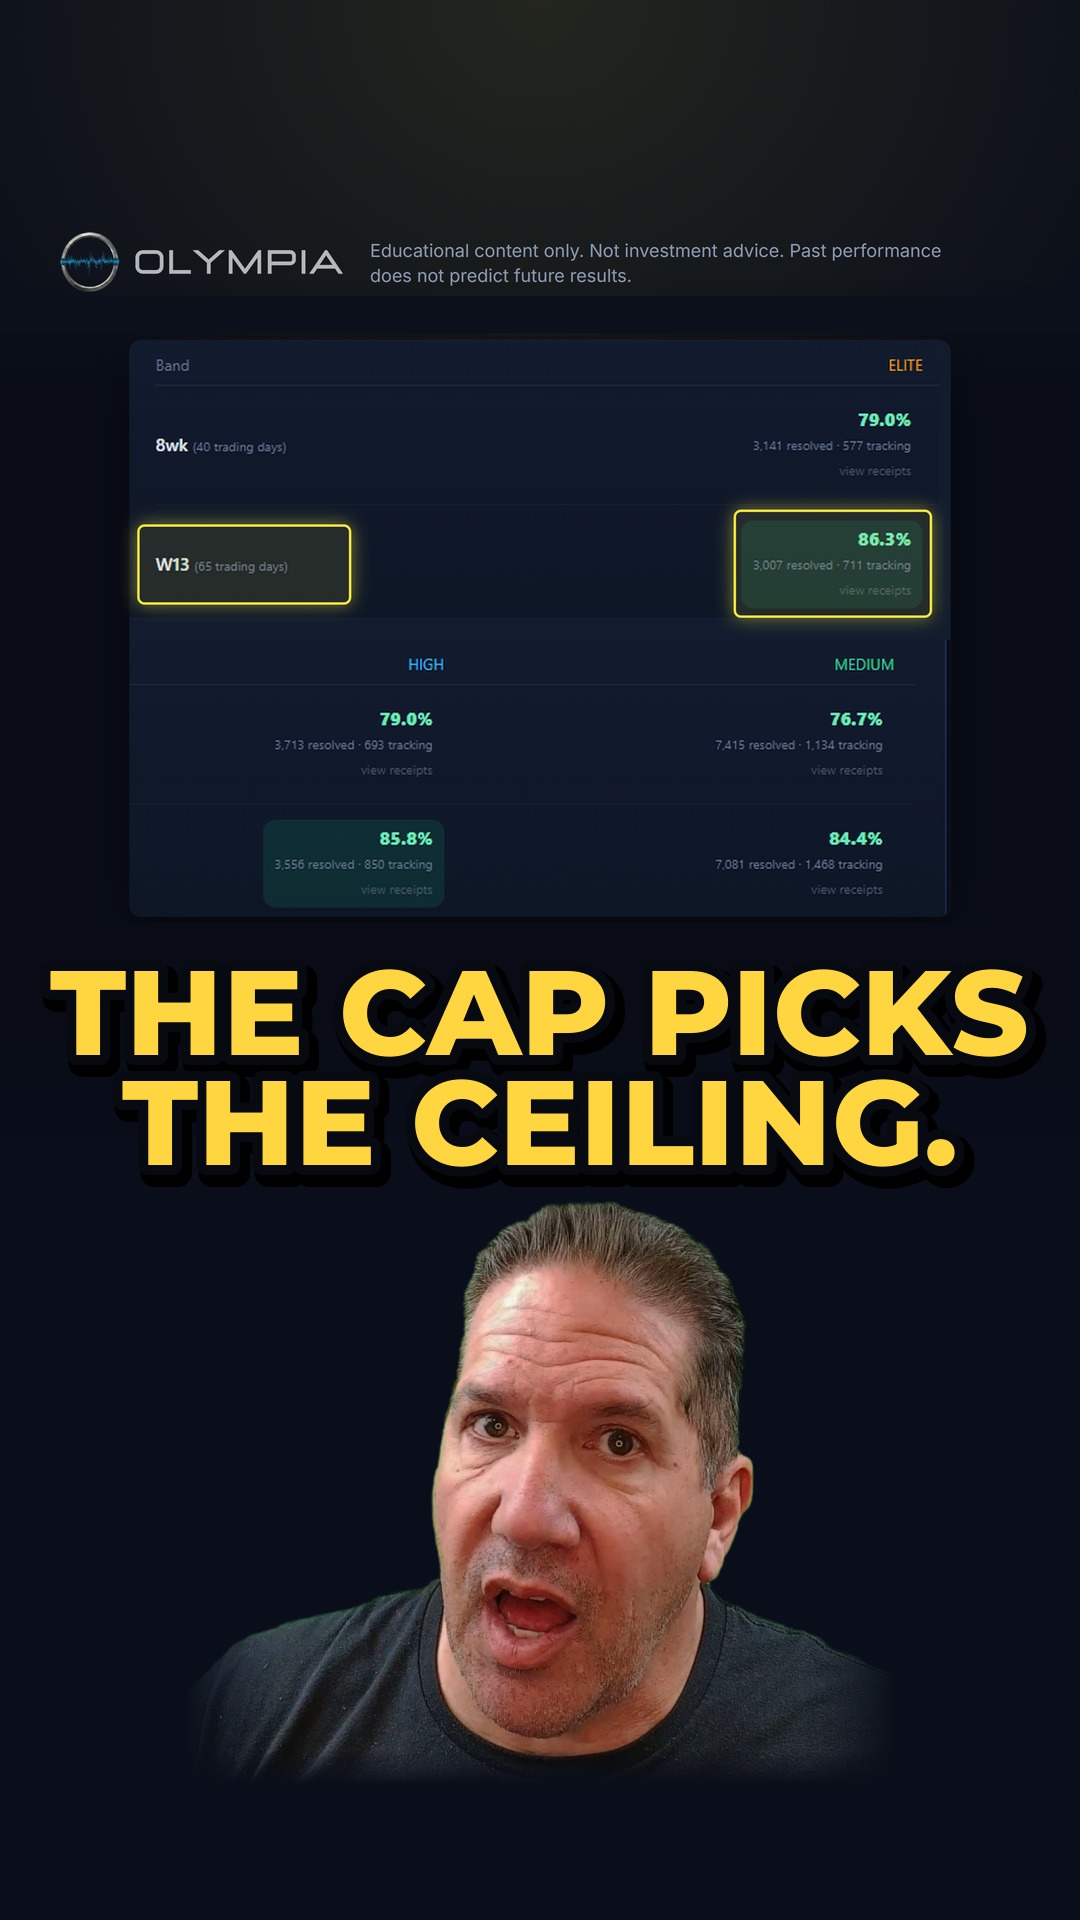
Sizing to conviction is more on the better record, less on the weaker — and then the cap wins. Whatever the maths asks, no name goes past 8% of the book on the steady pace, and it never sizes up on a loss to try to win it back. Conviction picks the size; the cap picks the ceiling.
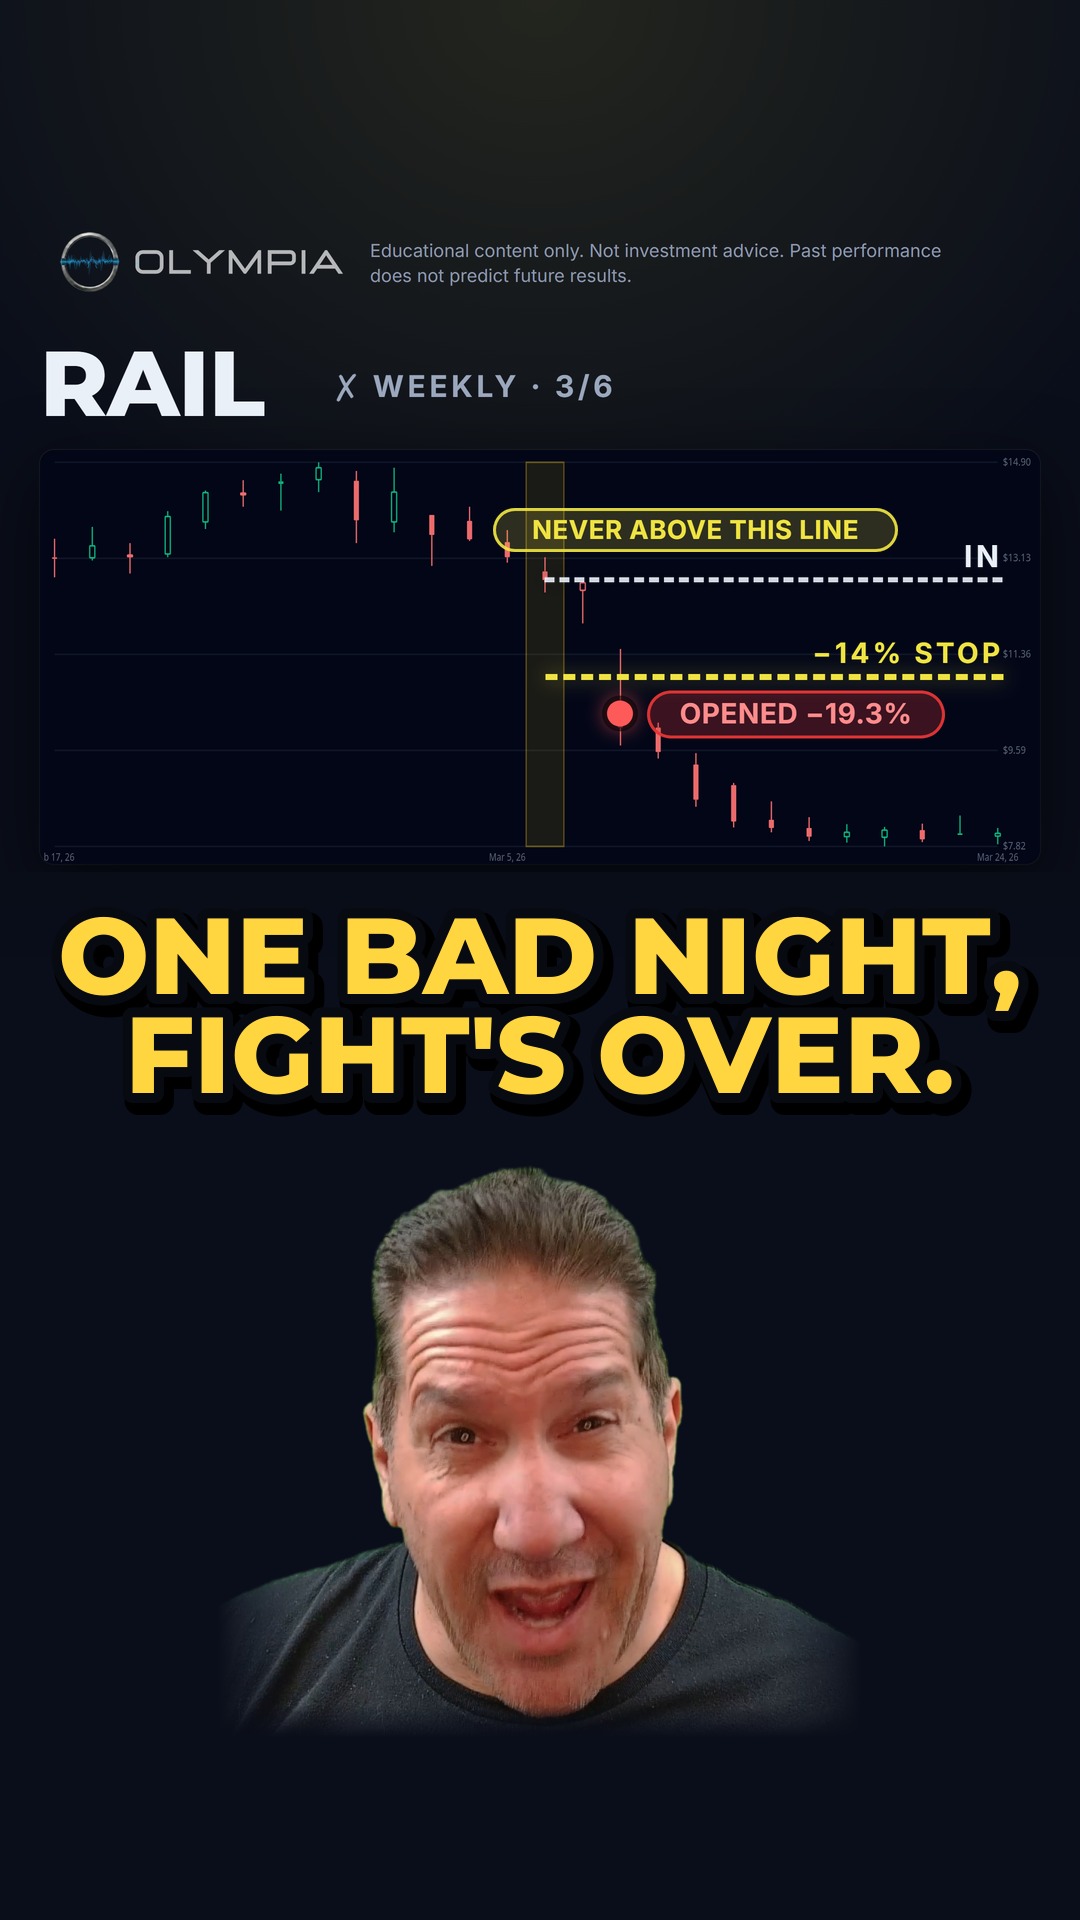
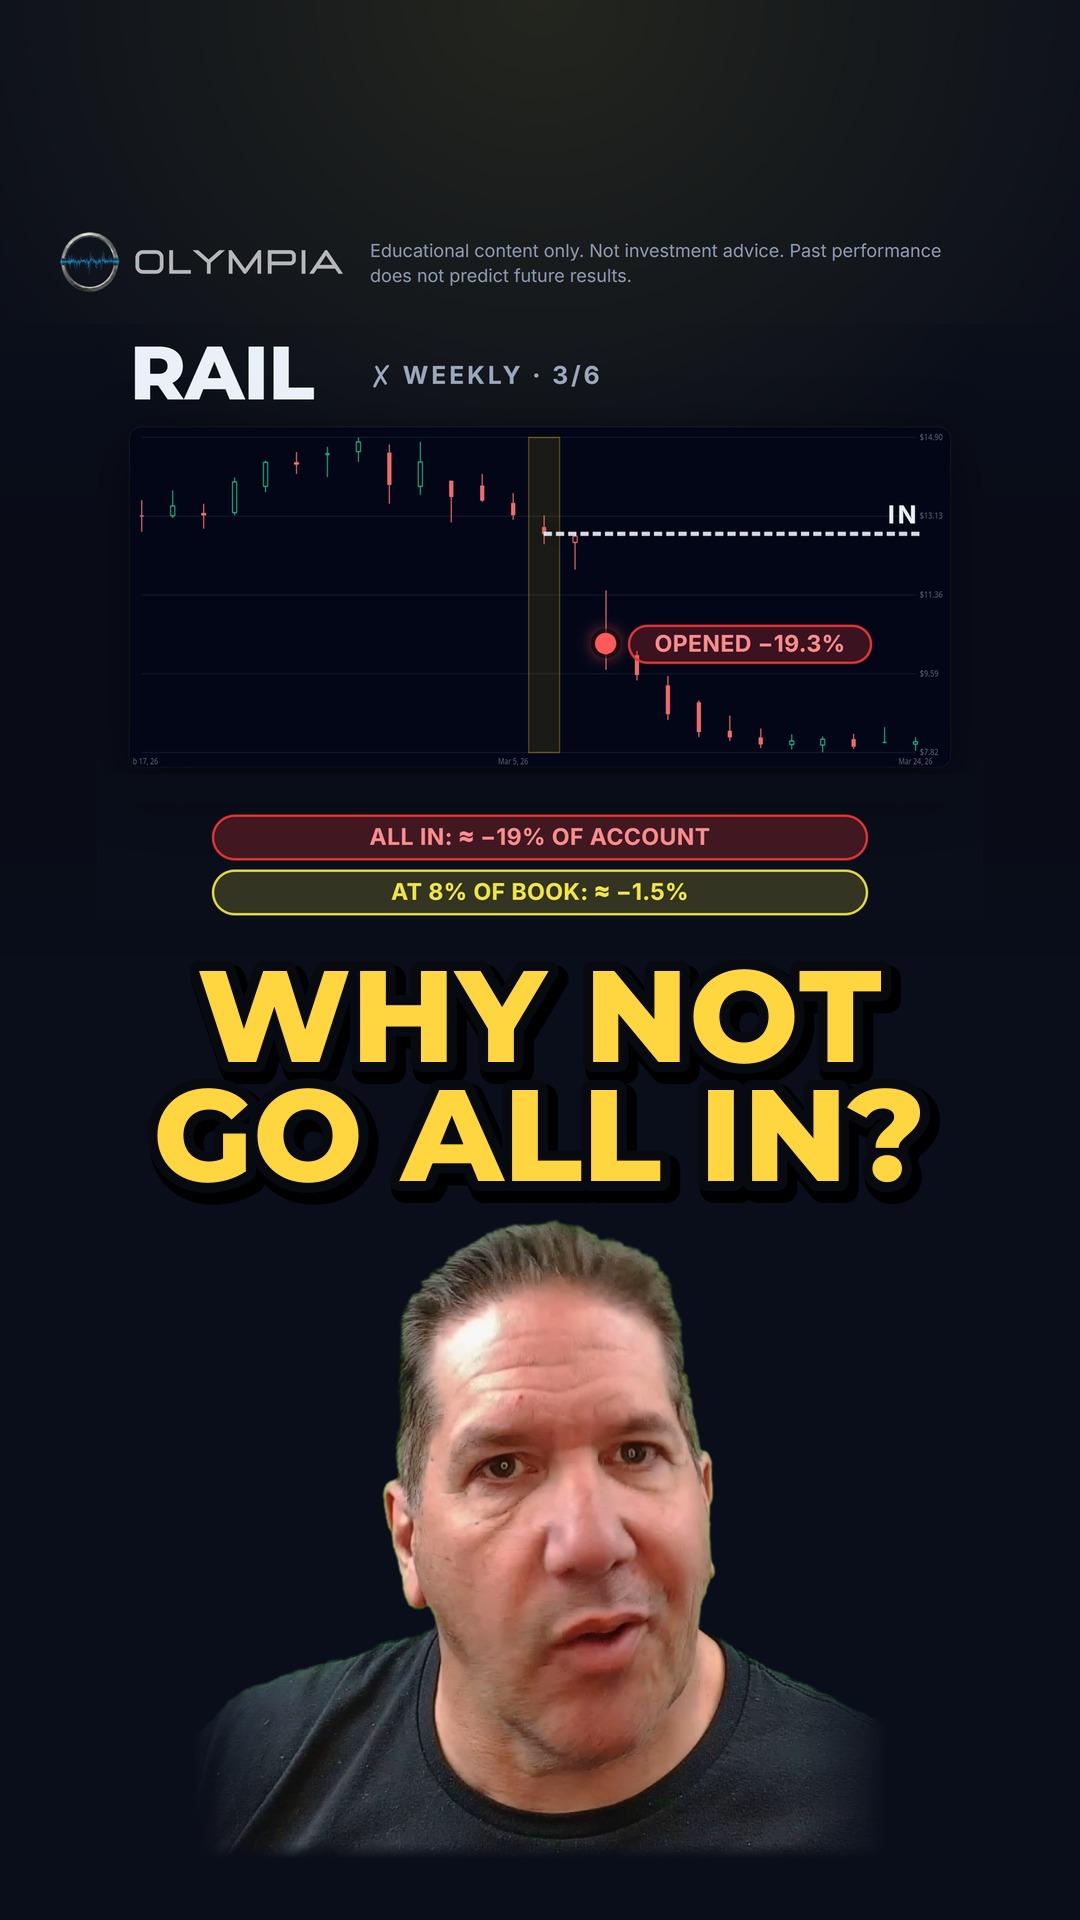
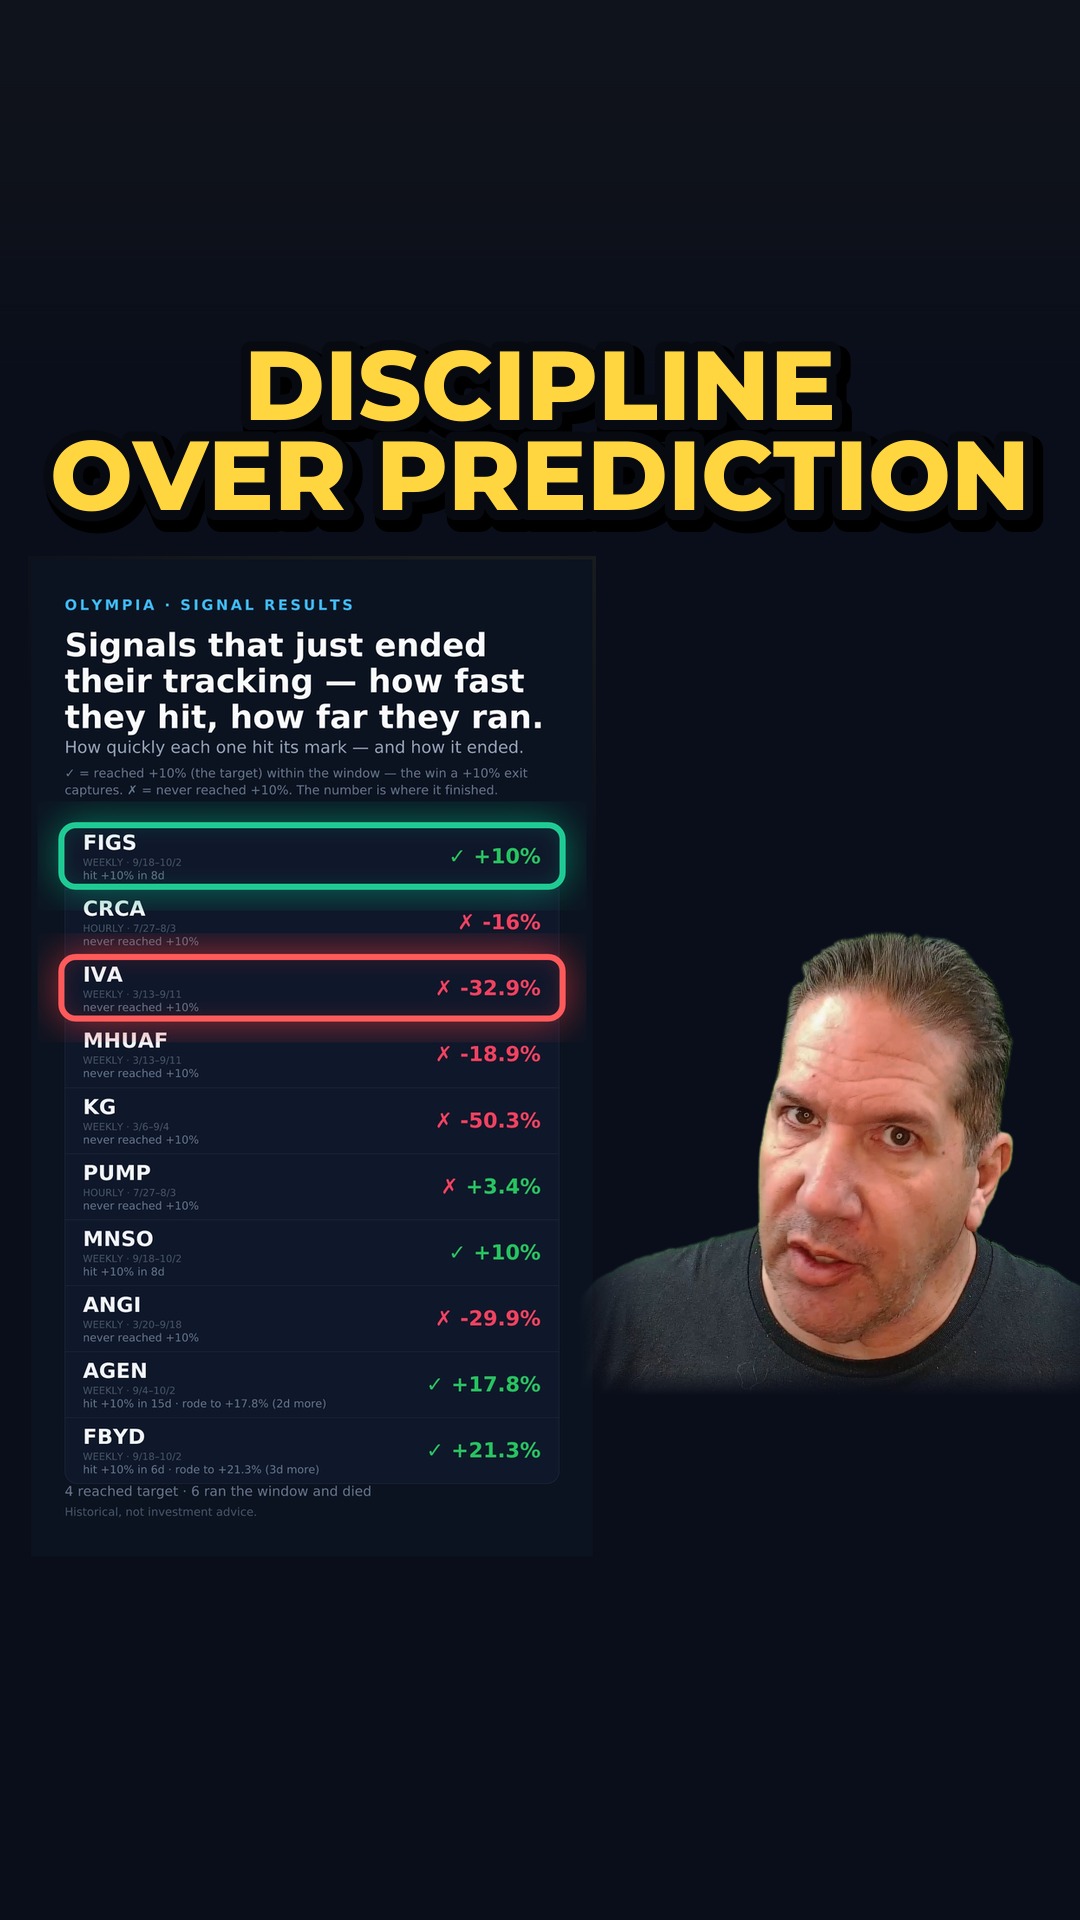
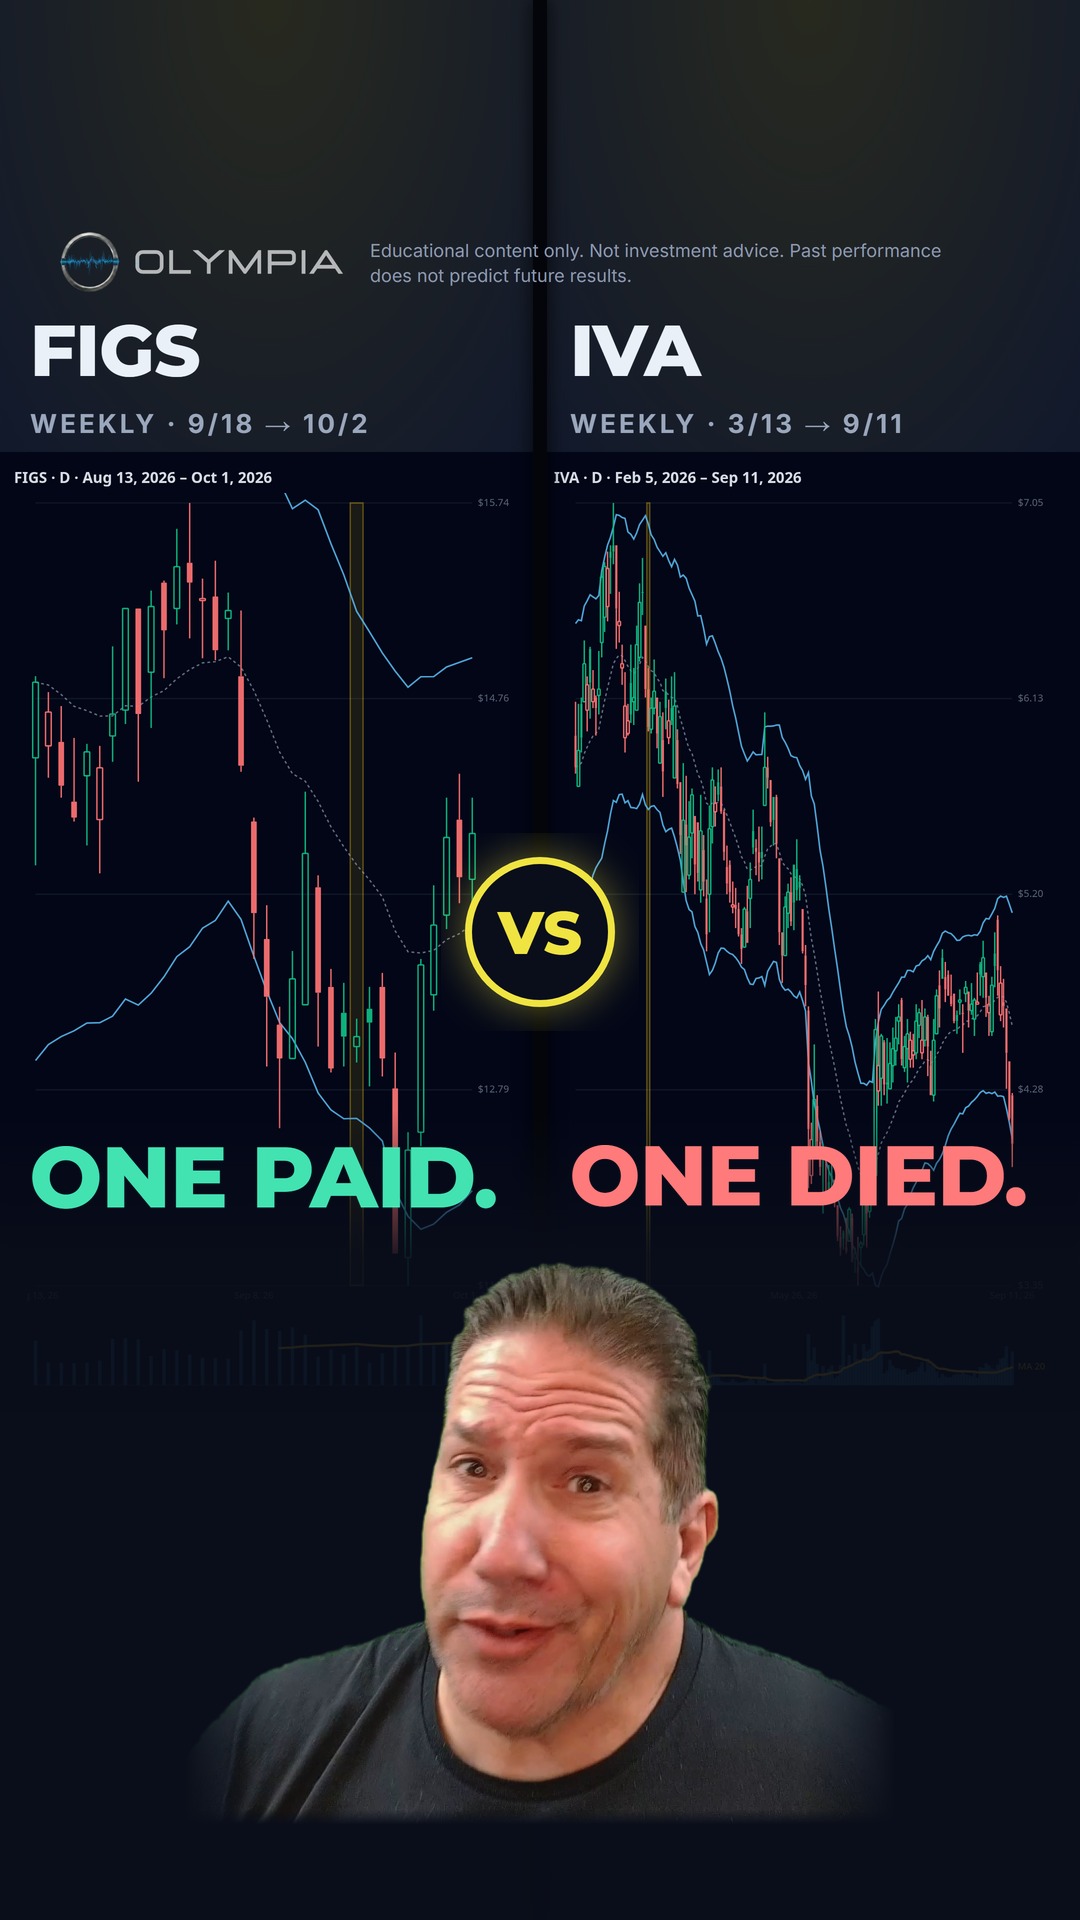
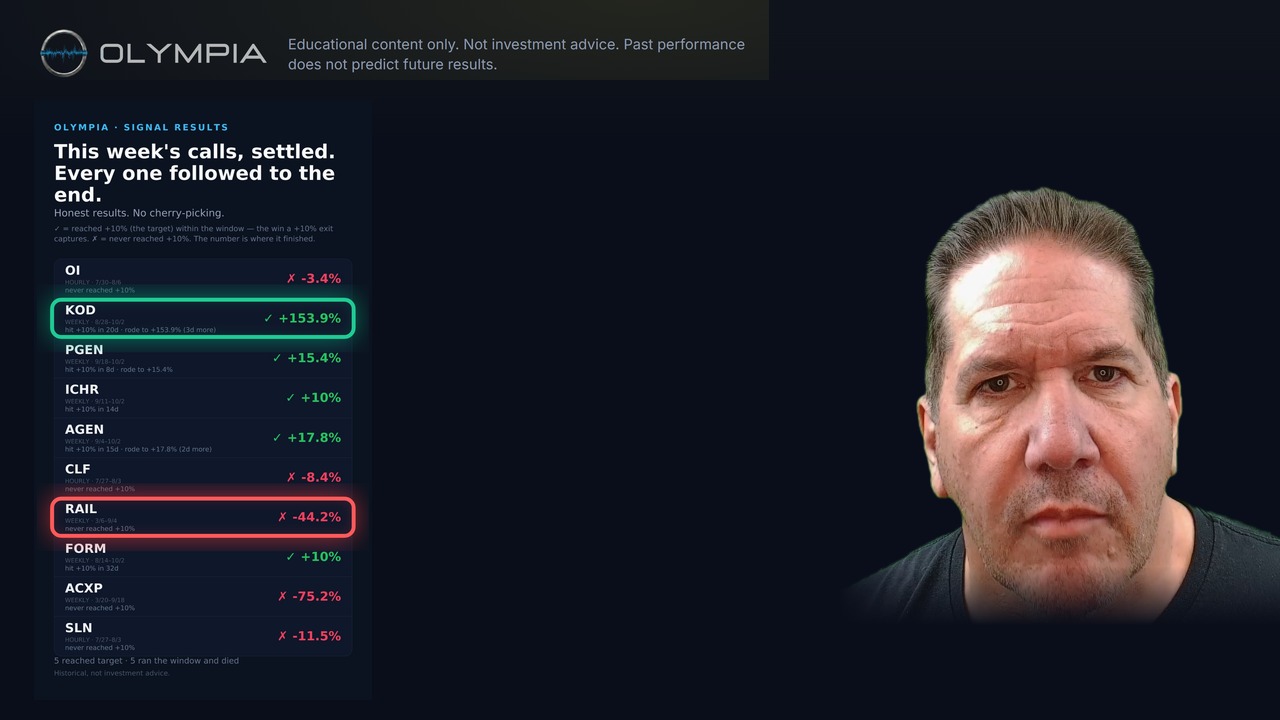
And the why: any idea can miss. All in on one, a gap like RAIL's is about a fifth of the account; at 8% of the book it's about one and a half percent. Dig a deep hole and you'll have a hell of a time climbing out — down 50%, you need 100% just to get back to even.
Where Olympia calculates it
Where you log a trade, Olympia shows the risk on each one from the stop you logged on each position in your own book. The total isn't on the screen, because that sum is yours.
In the window, every name it suggests from your book is capped — 8% on a steady pace, 12 on balanced, 18 on full — and it aims to spread what it suggests across at least three names.
It sizes each suggestion from its own record of that kind of signal: how often it paid, what it made, what it lost, and how long it took. That uses Kelly sizing and correlation matching — the size that grows money fastest on those odds — and then it takes a slice: a quarter on steady, half on balanced, three quarters on full.
Spread the loss out, cap it, add up the risk: it's all one job. No single punch can end a fight, and no single loss can take you out. Even your best idea gets a seat at the table — it just never gets the whole account.
Example numbers, not a member's: a $25,000 account, $250 at risk per trade, five positions, $2,000 in one name — every total on them is arithmetic. The per-name caps (8% steady · 12 balanced · 18 full) and the Kelly slices are the window's own settings. RAIL is a weekly signal from Olympia's record: it never traded above its entry and opened −19.3% on the morning of Tuesday 3/10, read from the daily cache; the −14% stop is the stop menu's tight weekly rung. Measured and backward-looking, not a forecast.