Where your stop loss goes — the measured ladder
Short · Exits & selling · October 7, 2026
Olympia publishes educational content for learning purposes only. Past performance is not indicative of future results. Nothing here is investment advice.
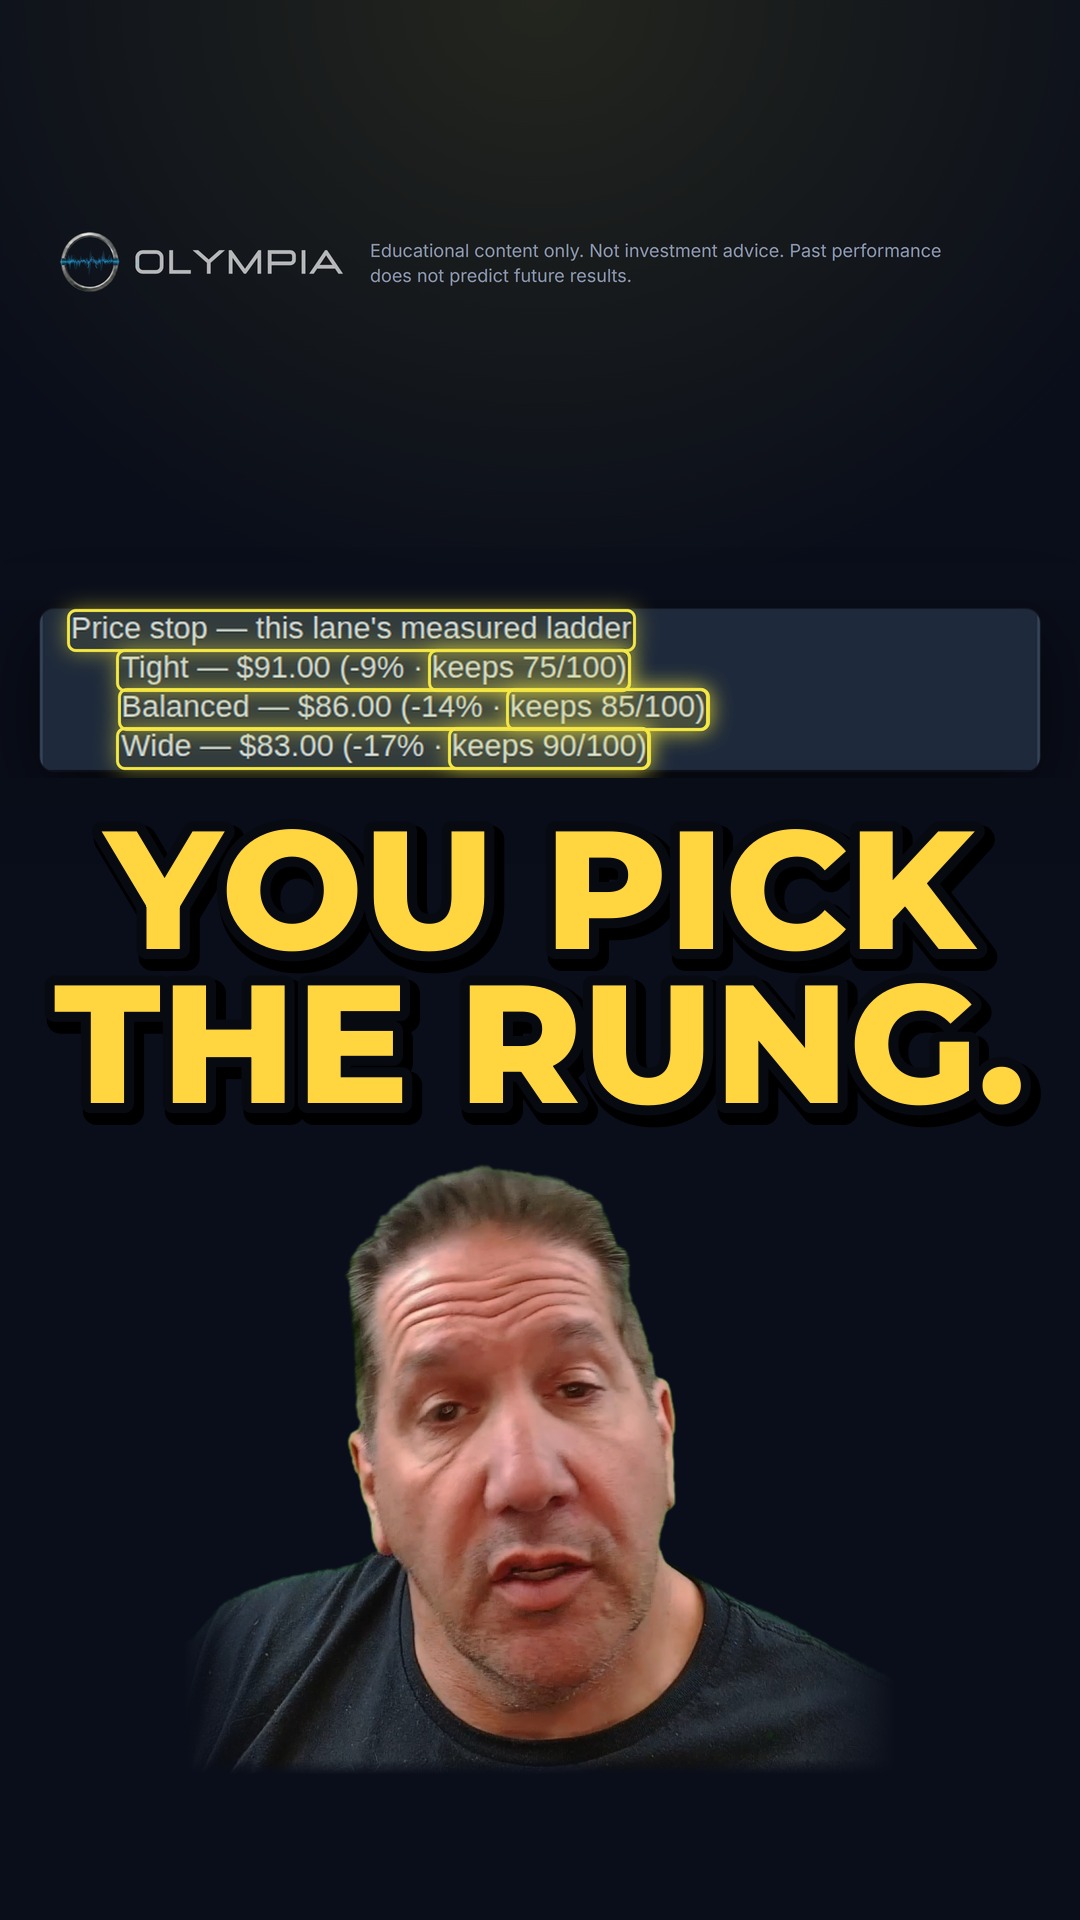
Too tight and you're jabbed out of a fight you were winning. Olympia doesn't guess the distance: for each kind of signal it took the ones that went on to pay and measured how far each one dipped first. For a monthly signal in at $100 — tight $91, balanced $86, wide $83.
Part of the full lesson: Stop loss or trailing stop? Which one, and where it goes
The lesson in writing
Set your stop too tight and you're getting jabbed — a jab you didn't see coming. You thought you were ready for it, but it came too soon and you missed it. Put you on the mat. Took you out of the fight.
What it is
So where does your stop loss go? Too loose, too tight — you're in trouble either way.
At Olympia we don't guess. We actually measured it: we go in, we look, and we measure it before we make any kind of decision.
How it's worked out
For each kind of signal, it took the ones on its board that went on to pay and measured how far each one dipped before it hit. That's the price stop on the stop menu.
For a monthly signal, in at a hundred: tight is ninety-one, and it kept seventy-five of every one hundred. At $86, which is balanced, it kept 85%. On a wide at $83, it kept 90%.
What kept means is that of every hundred that paid, that many never dipped below that price before they did.
You pick the rung. You decide how much you're willing to risk. You just know its price before you set it up.
Pairing that stop with a target, both measured, is in Stop loss or trailing stop? Which one, and where it goes.
The rungs and their kept counts are Olympia's own measured stop ladder for monthly signals, as it stood on 2026-09-29, read from its published record of signals that went on to pay. The $100 entry is an example number, not a member's. Measured and backward-looking, not a forecast.