Stop loss or trailing stop? Which one, and where it goes
Lesson · Exits & selling · October 7, 2026
Olympia publishes educational content for learning purposes only. Past performance is not indicative of future results. Nothing here is investment advice.
Everyone tells you to use a stop loss. Nobody tells you which one. The stop menu: a trailing stop, a measured price stop and a stop under support — and what each one has cost, measured on our own record.
The lesson in writing
Everyone tells you to use a stop loss, but nobody tells you which one, or how to get there.
I'm Mike, I built Olympia, and in our software we have a whole menu of stops. Every one of them has a price, and here's what our own record says.
What it is
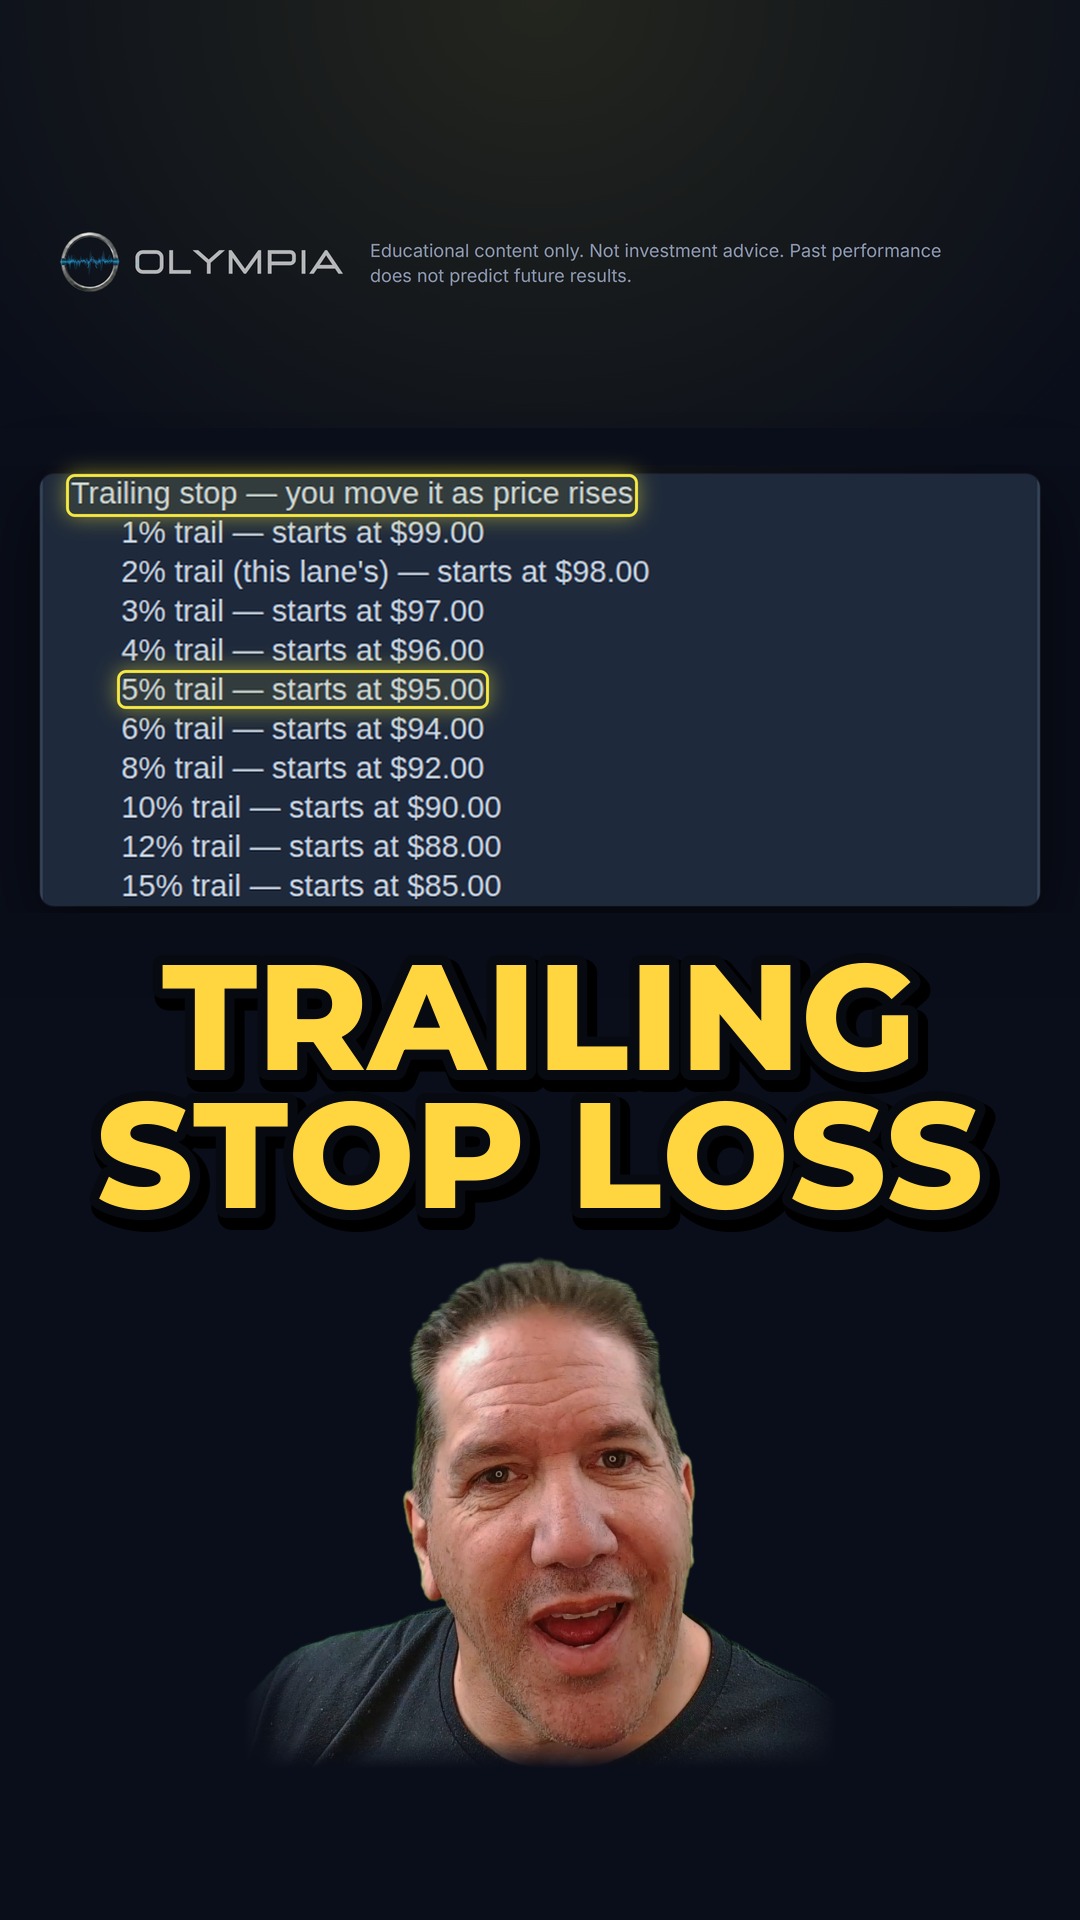
A trailing stop loss rides at a set percentage under the highest price since you bought it, and it never moves down. You can also set a trailing stop at a price that never moves.
A price stop is the rung you pick off the measured ladder — tight, balanced or wide — and you know its price before you set it.
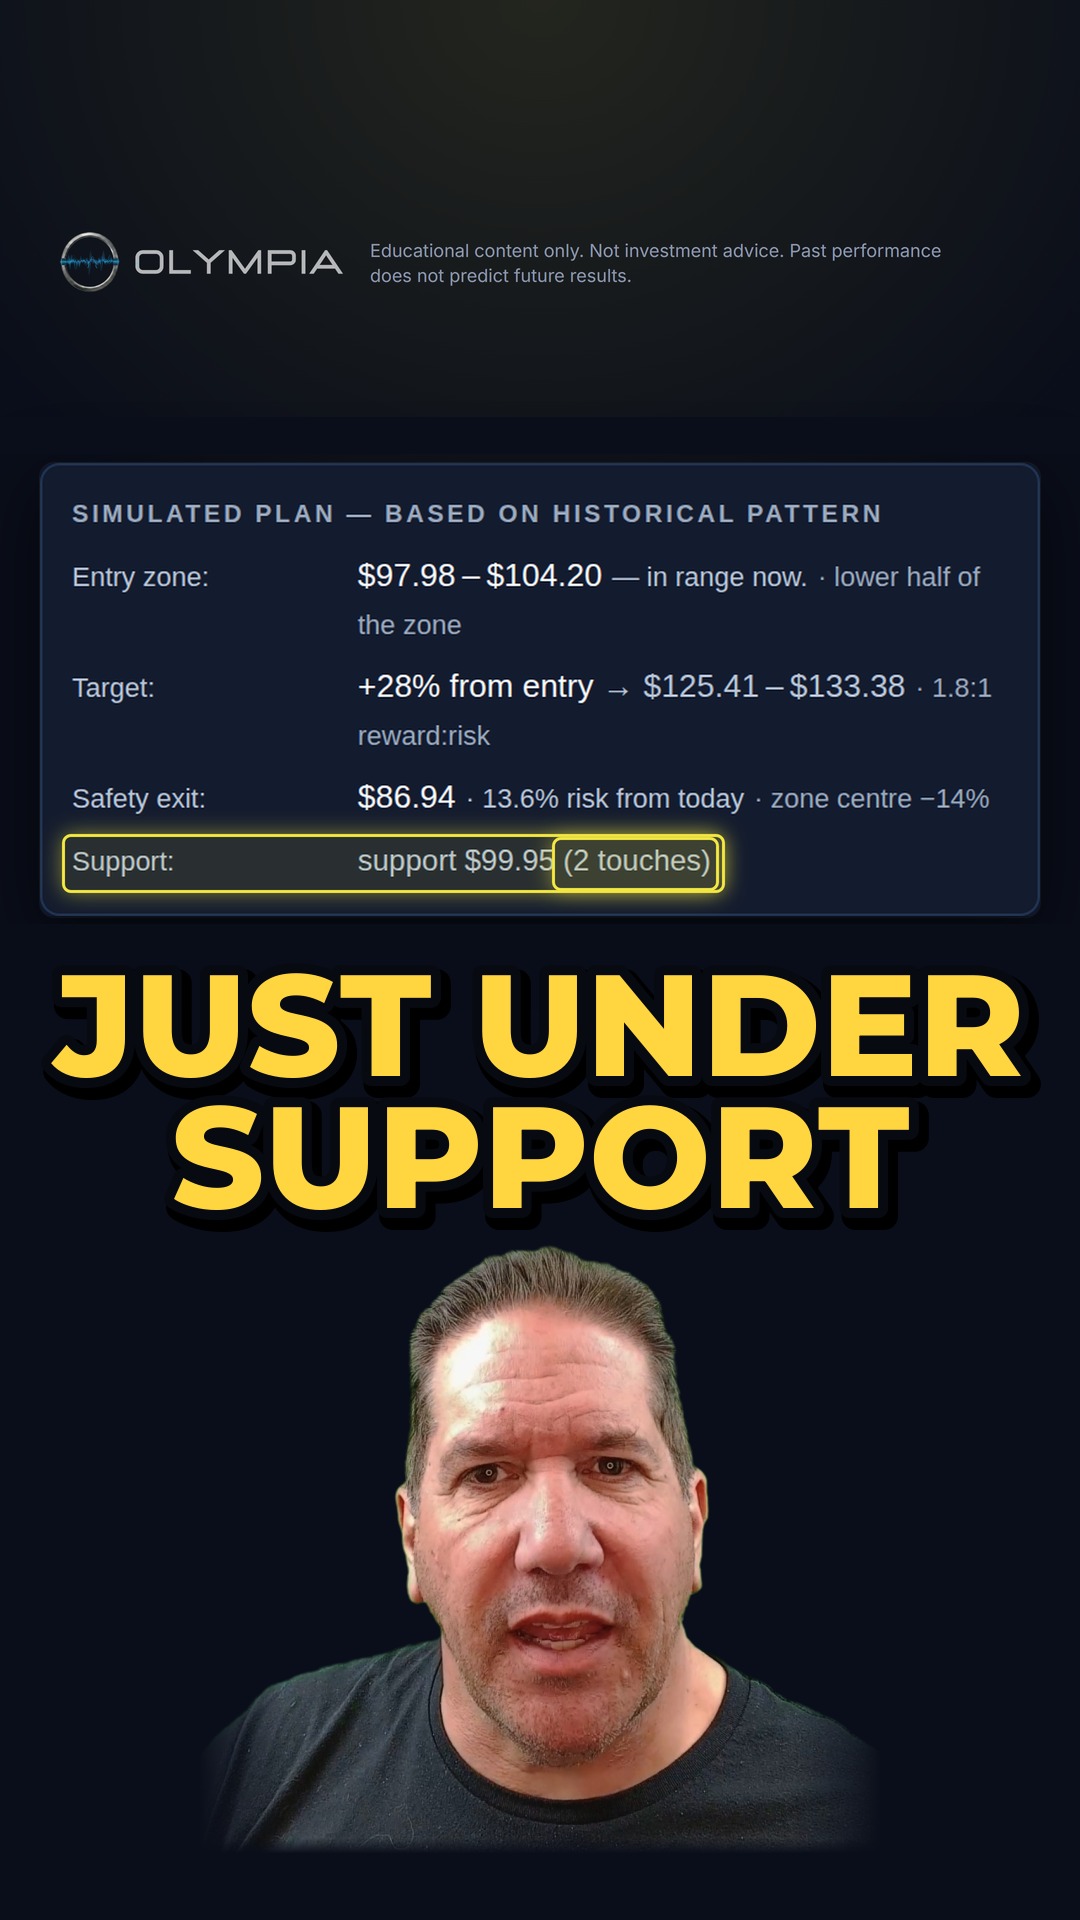
And a stop just under support uses a floor instead of a round number: support is a price the stock has bounced off before, where buyers stepped in at least twice.
How it's worked out
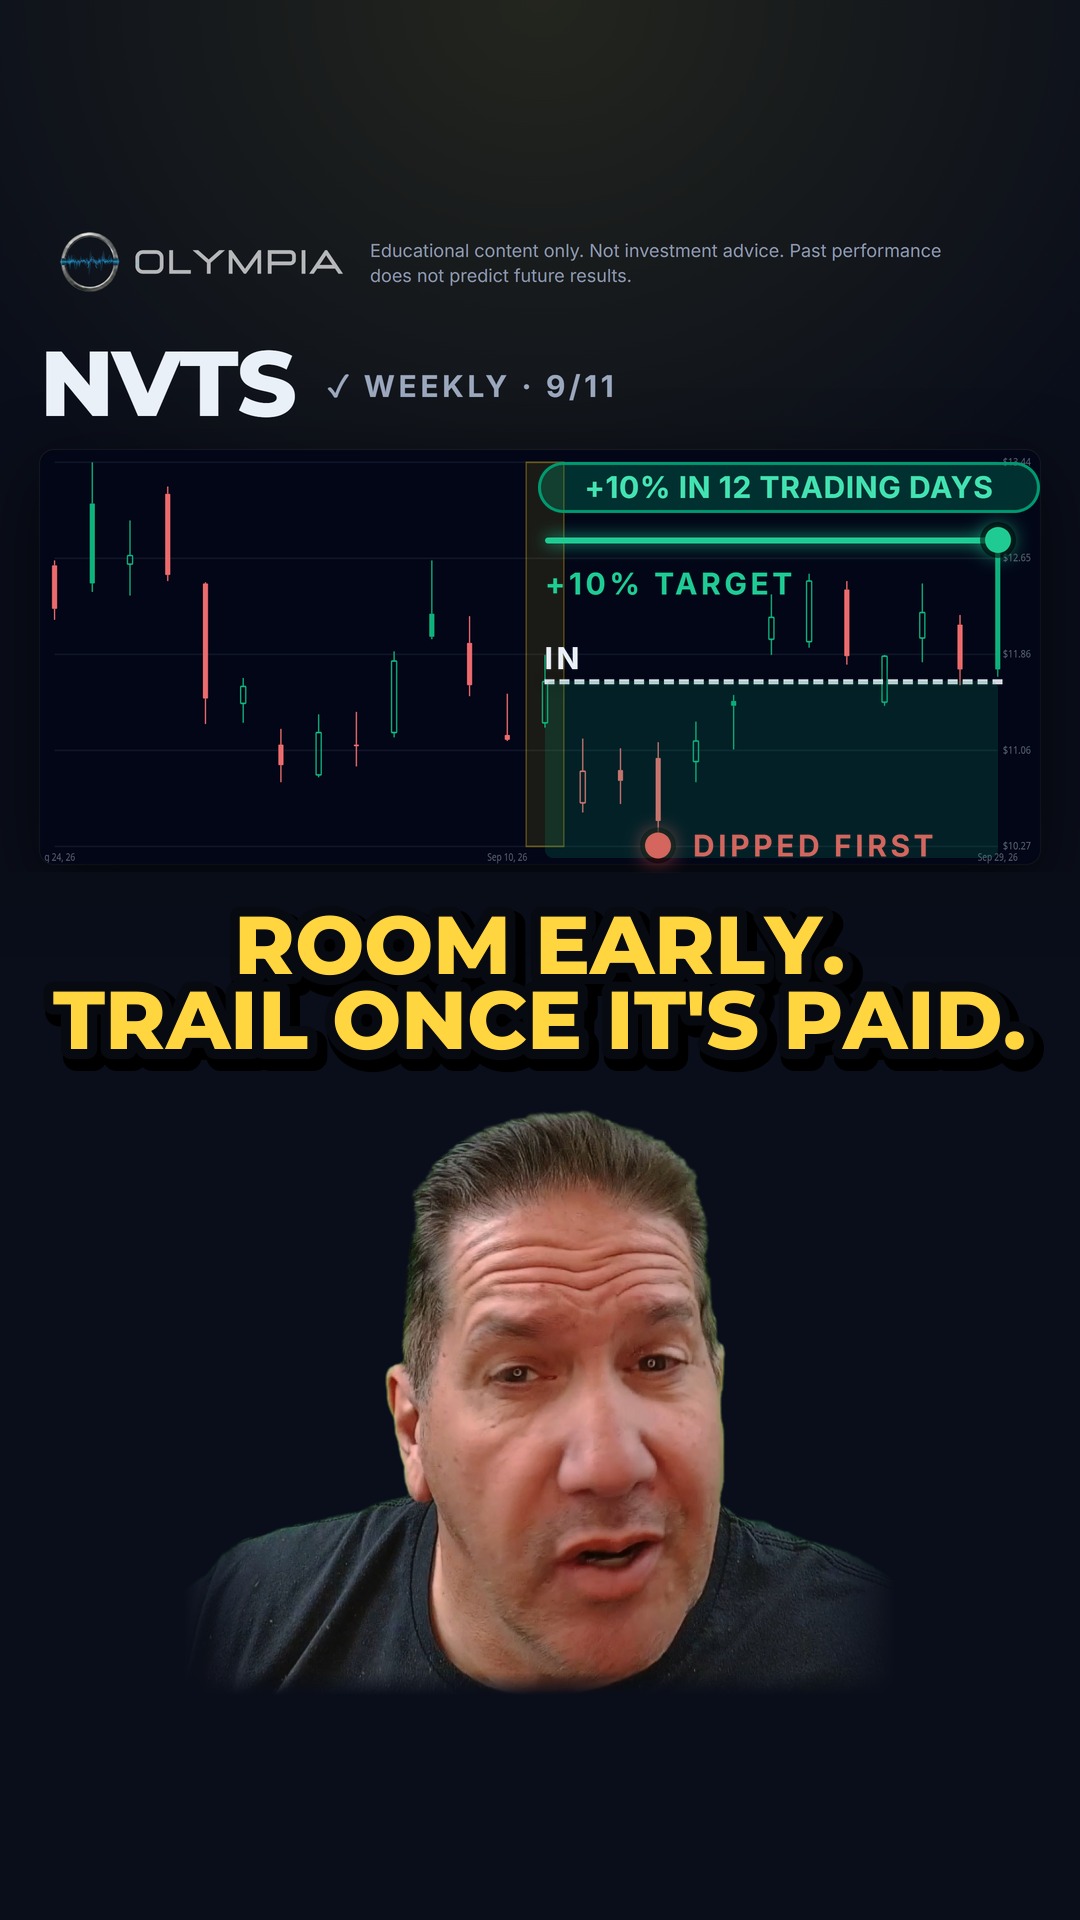
Set a 5% trail: you're in at $100 and it starts at $95. At $120 it's $114 — it goes up as the price goes up. The catch is how early it starts. On our own signals, about one winner in four dipped 14% before it paid the 10%, so a 5% or even 7% trail from day one throws out every one of those. Our weekly plan starts its trail only after the target, and that kept about 95 of every 100 winners.
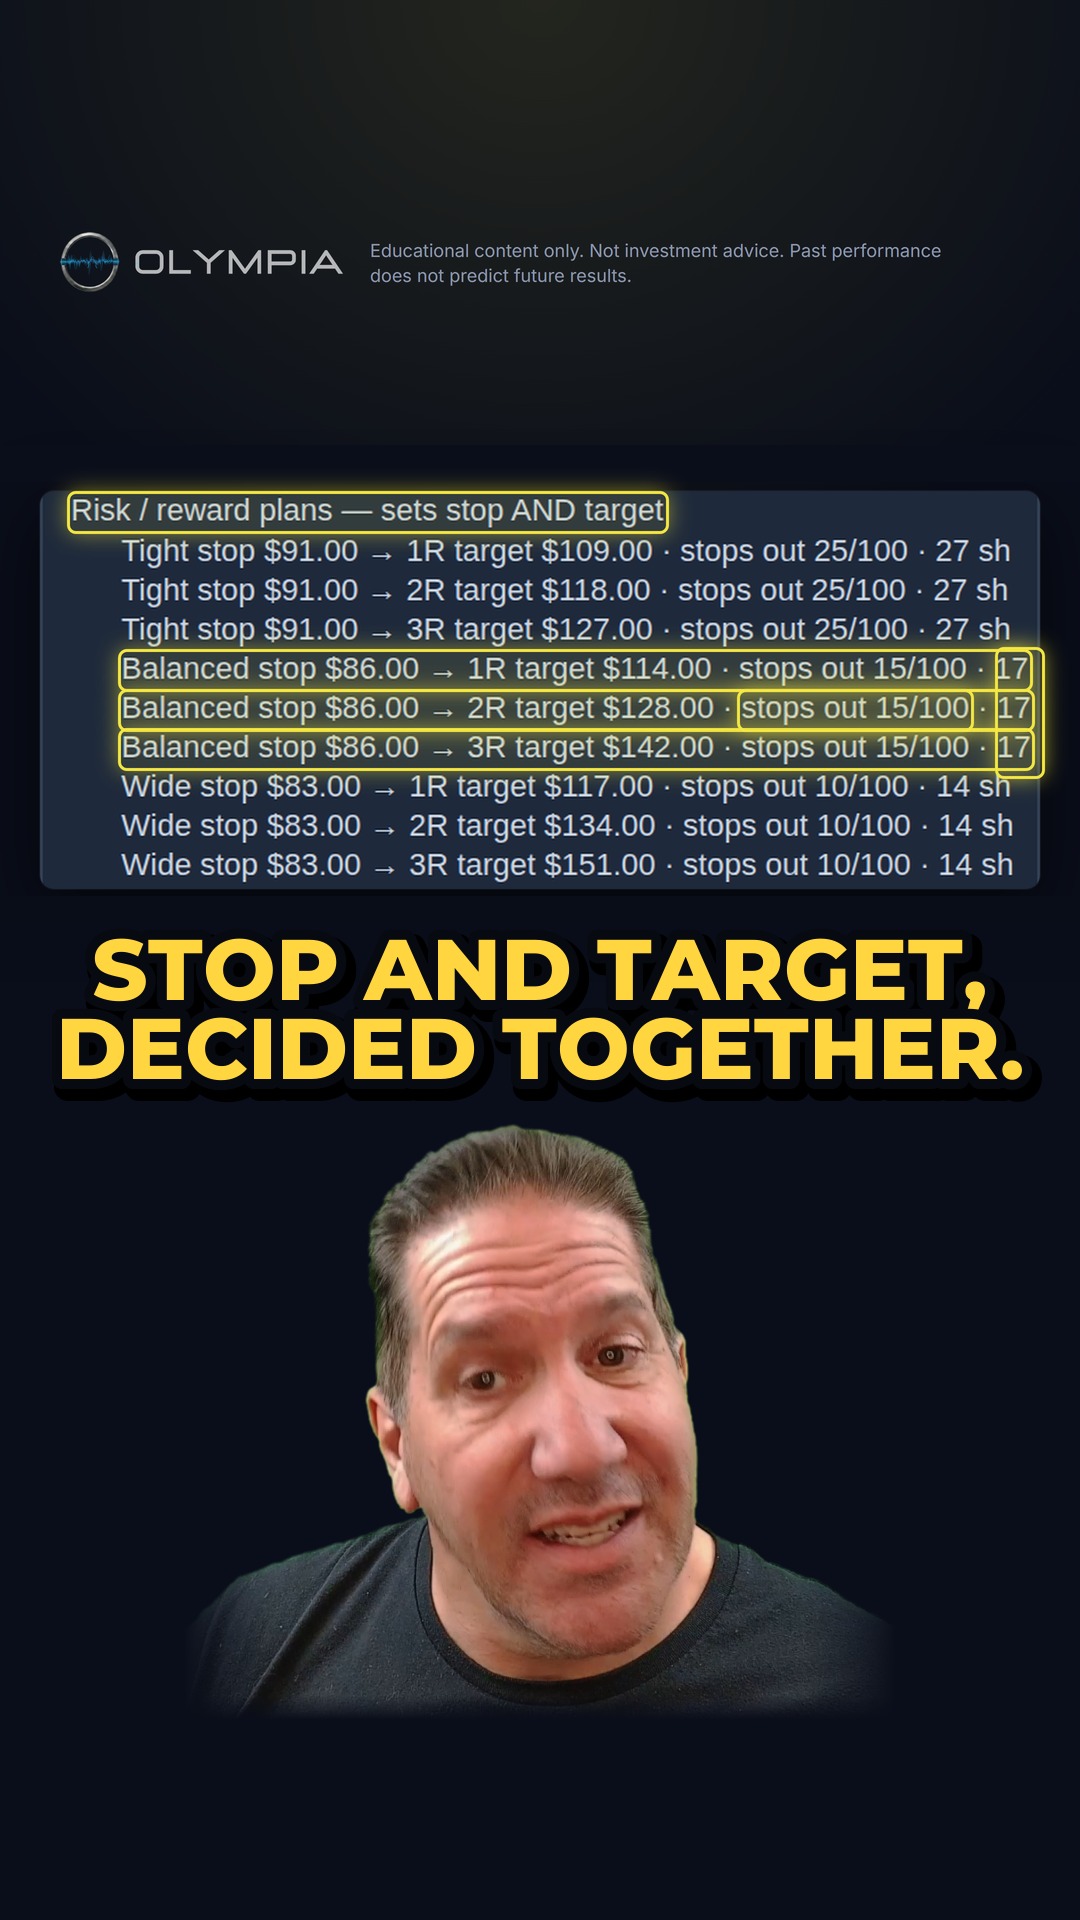
For the price stop, we don't guess — we measured it. For each kind of signal, Olympia took the ones on its board that went on to pay and measured how far each one dipped before it hit. For a monthly signal in at $100: tight is $91 and it kept 75 of every 100; balanced is $86 and it kept 85 of 100; wide is $83 and it kept 90 of 100.
A stop without a target is half a plan. Risk-reward picks both at once: the stop off that ladder, and targets in multiples of the distance to it — your R. In at $100 with the balanced stop at $86, $14 is 1R, so 2R is $128 and 3R is $142. Both sides are measured: that balanced stop stopped out 15 of every 100 that went on to pay, and of every 100 monthly signals with it, 2R came first about 39 times and 3R about 28.
A stop just under the nearest support kept about 80 of every 100 weekly winners — but only about 55 of 100 monthly ones. On a trade that long, the nearest floor sits too close.
Where Olympia calculates it
You enter the price you got in at. Once that price is in, Olympia calculates your trailing stops and tells you what to set it at — the percentage, how far to trail by, and what you end up with.
The stop menu lists every pairing with the share count for $250 at risk — 17 shares on this one — and the measured counts beside each rung.
Under structure, it finds the nearest support for you, with its price and how many touches. Fewer than two touches and it won't call it a floor, so it won't show one.
Why it's worth doing
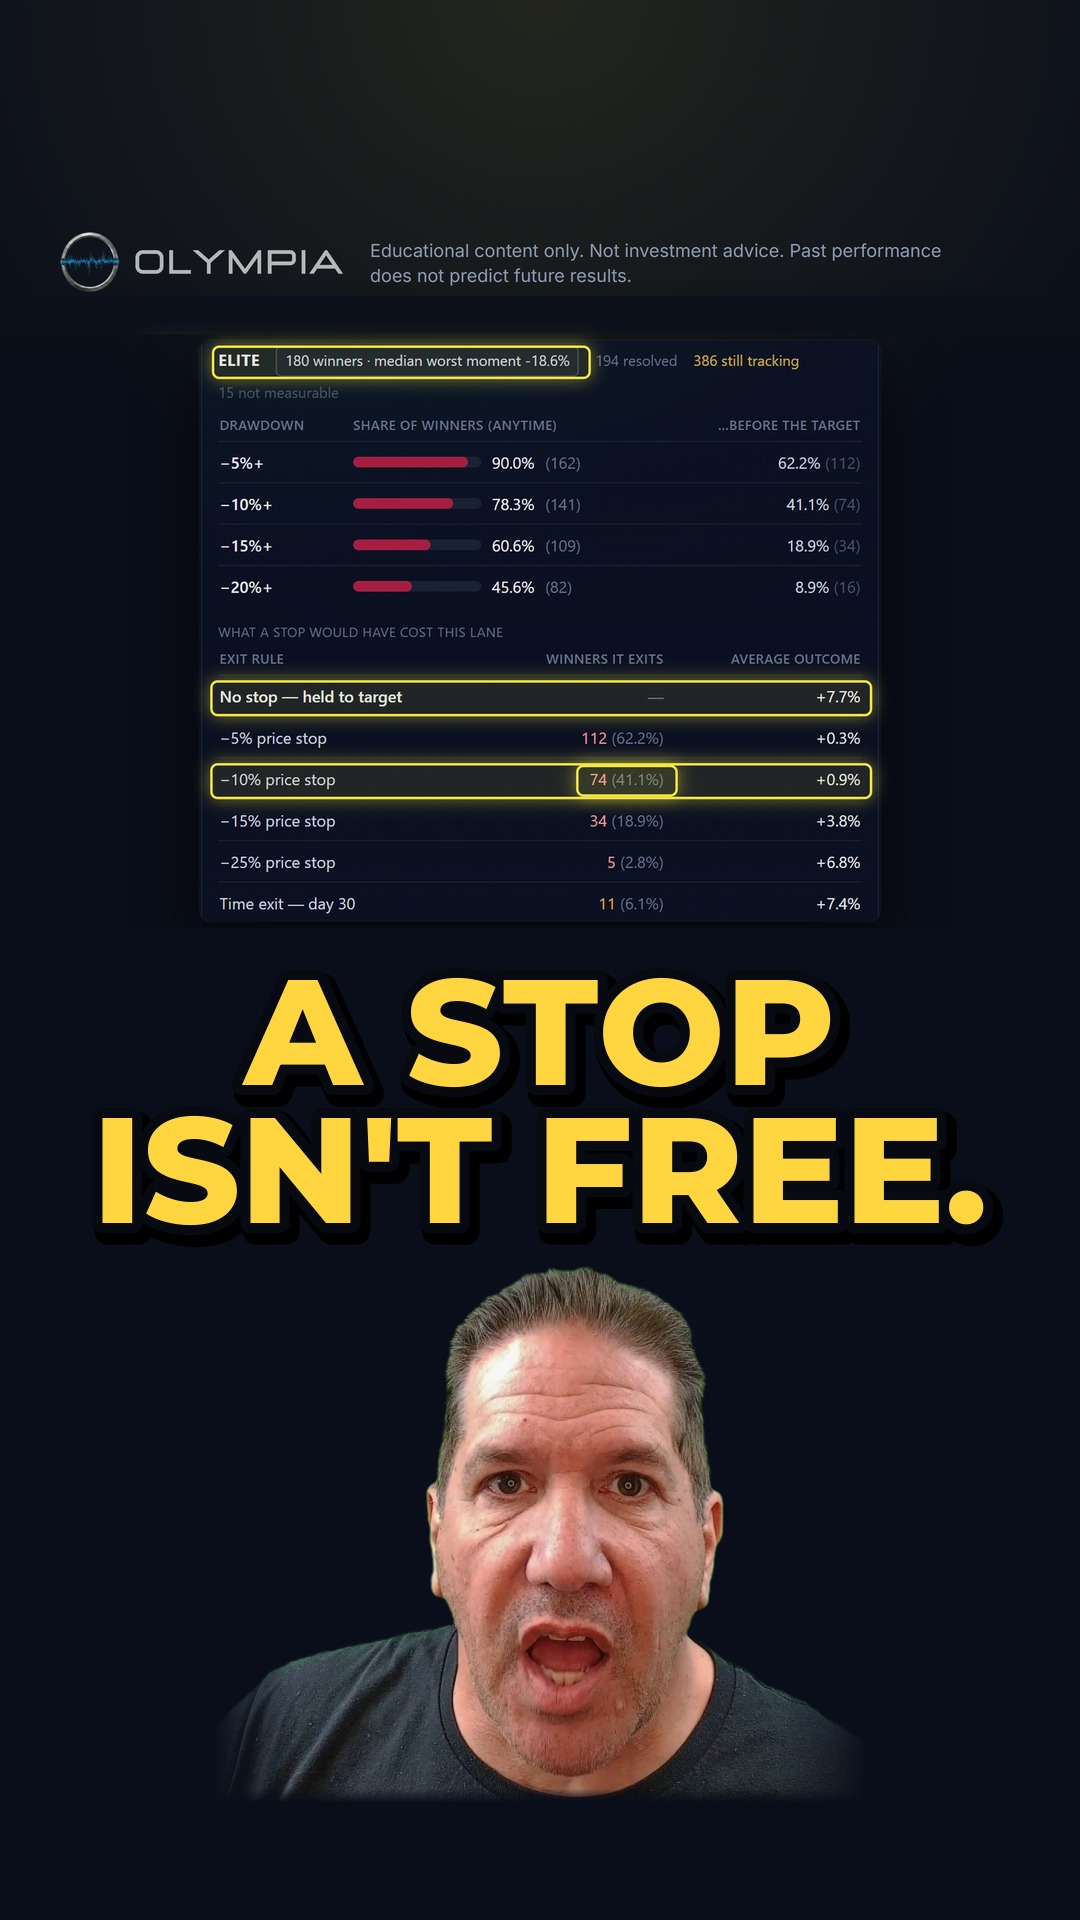
Why not just pick one stop and be done with it? Because the usual picks cost more than they look. On our top-tier daily signals, a flat 10% stop would have thrown out about 40 of every 100 that went on to pay. And no stop at all leaves nothing between you and the one that never comes back.
A stop isn't free — even a measured one throws out some winners. What it buys is a way out of the trade that keeps falling. You're picking your stop with the price tag showing.
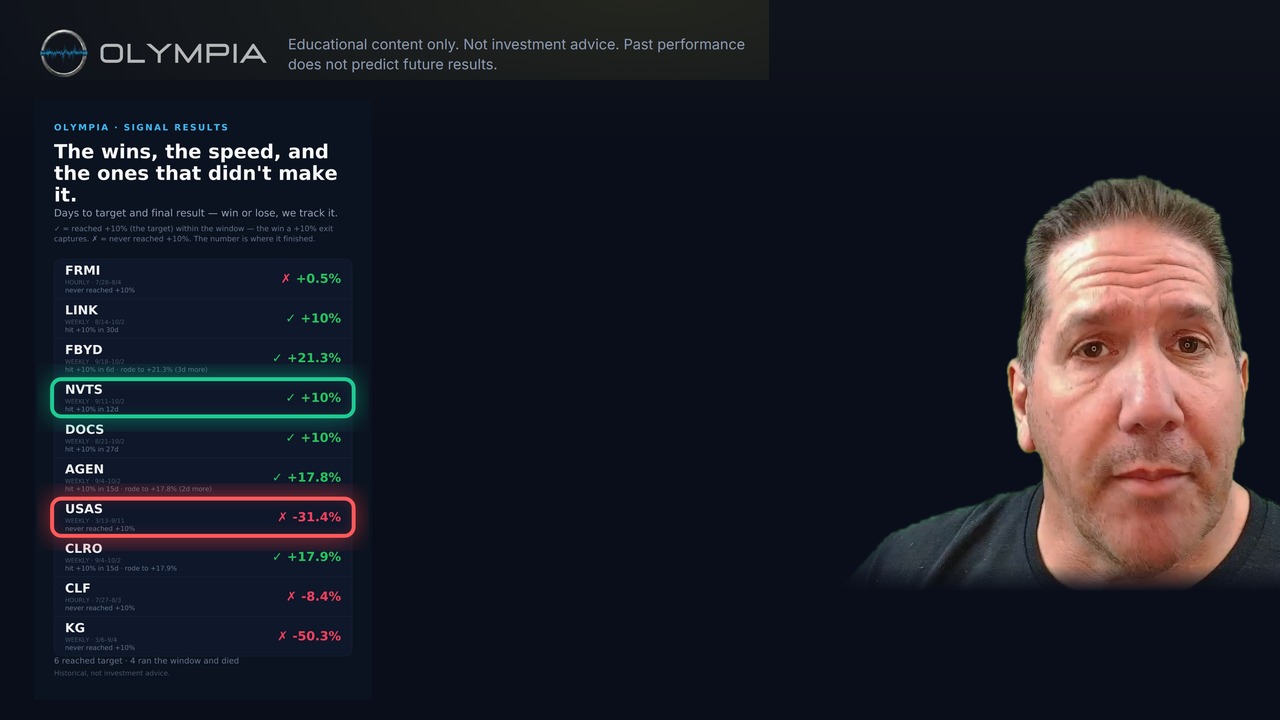
The kept counts are Olympia's own measured stop ladders, read from its published record of signals that went on to pay, misses included — the monthly ladder as it stood on 2026-09-29. The $100 entry, the $250 at risk and the 17 shares are example numbers, not a member's; the R multiples are arithmetic on them. Measured and backward-looking, not a forecast.